Showing posts with label Capital Markets. Show all posts

Tuesday, September 26, 2023

Instacart: The Early Bird Gets the Worm?

The IPO market has largely been dormant for the past 18 months. However, hopes of a revival were kindled recently as several high-profile companies went public in the last two weeks, including pandemic darling Instacart.

 
                                         Source: stockanalysis.com. *Includes REITs, SPACs, closed-end funds, ADRs, 
                                         banks, limited partnerships and trusts, **Thru 9/22/2023.

The grocery delivery service's IPO on Sep 19 was priced at $30, valuing the company at ~$10 billion. That was far below its (infamous) March 2021 funding round which valued the company at astonishing $38.5 billion!! Oh, 2021. Now, $30/share seems to be a fair price according to valuation guru Aswath Damodaran in a detailed analysis of Instacart's business model. And the market agrees? After a strong debut (gaining 43% on its first trading day), Instacart fell back to its IPO price within a week.

Regardless, Instacart was estimated to have raised $660 million from its IPO, with all three of the company's co-founders cashing in: "Brandon and Maxwell Leonardo sold 1.5 million of their 7.8 million shares, pocketing about $43 million each, while former CEO Apoorva Mehta sold 700,000 of his 28.9 million shares, netting $21 million. Mehta, a great example of entrepreneurial grit and perseverance, is now worth an estimated $1.3 billion. Prettay, prettaay, good. So, who were the other winners from Instacart's IPO, if any?


The chart above (click to enlarge) shows Instacart had a lot funding rounds (up to Series I) and many investors. But if you didn't get in early, you didn't do too well. Series F and later investors lost money outright, but it gets even worse if you consider relative performance. As this table (click to enlarge) from Damodaran's analysis demonstrates: 

Source: Aswath Damodaran (aswathdamodaran.substack.com)

As per Damodaran, the seed capital providers Khosla, Canaan and Y Combinator will have earned a 55% compounded annual return on their original investment...well in excess of the S&P 500's annual return of 13% over the same period. Or put it another way that's an 80x (gross) return vs 3.4x for the S&P 500. Nice! If the typical VC seed investment in 2012 was about $600-$700K, then that's a potential gain of around $50 million! Silicon Valley's pre-eminent VC firm, Sequoia, will have done even better, earning 62% on its 2013 Series A investment of $8 million as per the WSJ; that's a potential gain of over $600 million--cha ching!! Andreesen Horowitz ("a16z") will have earned a 29% annual on its 2014 Series B investment (on a $15-$20 million investment, that would be a potential gain of $100-$150 million). 

After that things start to unravel...all investments in Instacart made after 2015 have underperformed the S&P 500 significantly, and the NASDAQ by even more. In fact, any investment made after 2018 generated an (unrealized) dollar loss! Hedge fund crossovers, Tiger, Coatue, and D1 underperformed but so did established VCs like DST Global and General Catalyst, who invested $75 million and $50 million, respectively. The worst off possibly was T. Rowe Price, whose growth fund invested $86 million in 2021. That investment has lost more than half of its value. 

To be sure, firms like Sequoia have invested in multiple rounds, taking some of the shine off their early perspicacity. But the success of those early rounds more than makes up for the losses of the later rounds. Sequoia, in fact, invested $300 million across all funding rounds prior to Instacart's IPO and currently owns more than 15% of the company; its stake is estimated to be worth over $1.5 billion. Interestingly, perhaps aware that a successful Instacart IPO was needed to help thaw a frozen IPO market for their other portfolio companies, Sequoia and other VCs agreed to buy up to $400 million worth of shares sold in Instacart's IPO, accounting for ~66% of the total proceeds. Unless they immediately sold, they are essentially holding those shares at cost less than a week later. 

Ultimately, Instacart's IPO was an expensive lesson in market timing and herd mentality. Yes, the early bird does get the worm...but habit rules the unreflecting herd. Invest carefully.

Monday, July 4, 2022

The Three Types of Inflation

Inflation is dominating the news. While the price of everyday goods, including food and energy—naturally—grab the headlines, the ever-interesting Visual Capitalist reminds us of the other forms inflation within the economic system that impact our lives.

The first is monetary inflation, which occurs when the U.S. money supply increases over time. This represents both physical and digital money circulating in the economy including cash, checking accounts, and money market mutual funds. In the U.S. the Federal Reserve typically influences the money supply by printing money, buying bonds, or changing bank reserve requirements. The Fed controls the money supply in order to boost the economy or tame inflation and keep prices stable. 

Nobel Laureate Milton Friedman once posited that "inflation is always and everywhere a monetary phenomenon." That's because, in theory at least, increasing the money supply faster than the growth in real output may cause consumer price inflation (# 2 below); more money chasing the same amount goods should eventually lead to increases in prices.

                                               Source: Visual Capitalist, New York Life Investments

Next is consumer price inflation ("CPI"), which occurs when the prices of goods and services actually increase. It is typically measured by the Consumer Price Index (CPI), which shows the average price increase of a basket of goods, such as food, clothing, and housing. Supply chain issues, geopolitical events, monetary supply, and consumer demand may all affect CPI. When CPI is persistently increasing at rate above 2% per annum, the Fed may increase interest rates to curtail spending and allow prices to cool down, and vice versa.

Lastly, asset price inflation ("API") represents the price increase of stocks, bonds, real estate, and other financial assets over time. One measure of API is the ratio of household net worth to GDP. Often, a low interest rate climate creates a favorable environment for asset prices by lowering the total cost of asset ownership. This has been evident over the past decade as low rates were met with rising asset prices. In 2021, household net worth as a percentage of GDP stood at 620%. Rising asset prices can sometimes be a misleading sign of a strong economy since no real output is produced—the stock market is not the economy. Instead, it may indicate an asset bubble, which is dangerous because it contributes to rising inequality (as typically the very rich own the vast majority of economic assets). But when bubbles burst, the government has to step in with taxpayers' (i.e., everyone's) money to save the economy (and thereby the rich). The moral hazards in a laissez-faire capitalistic system can give rise to demagoguery.

Saturday, January 22, 2022

Biden To the Fed: Do Your Job!

The post-Global Financial Crisis ("GFC") environment has long been plagued by low growth and deflationary pressures. Supported by by ultra-low interest rates, growth hungry investors have for years piled into risky assets like cryptocurrency and companies with questionable "growth-at-all costs" business model. Profits? What's that?...Investors merrily did so because of the justified belief that the Federal Reserve had their backs. The stock market is, of course, not a part of the Fed's dual mandate of stable prices and maximum employment. However, successive Fed regimes have been wary of any negative feedback loop a declining stock market might have on the real economy and typically responded to market volatility with injections of liquidity. The Fed's obsession with the so-called "wealth effect" has contributed to growing economic inequality, even by the Fed's own admission. But suddenly, some would say predictably, inflation is back after four decades (admittedly, this blog was firmly in the transitory camp). The Consumer Price Index rose to a 39-year high of 7.1% in December, well above the 3.2% average over the past 42 years and the 1.8% per annum since the GFC. 

Source: The St. Louis Fed, Mantabye

Now the Fed has to choose between its Congressional duty and Wall Street. Quite the quandary! President Joe Biden, for one, has no confusion about where the Fed's focus should be as inflation becomes voters' biggest concern. He helpfully reminded Fed Chair Jay Powell of his duties this week:


And Wall Street may be starting to feel that the Fed might actually listen to him:

Source: Yahoo Finance, Mantabye

Saturday, January 8, 2022

The Year in Markets: 2021 Edition

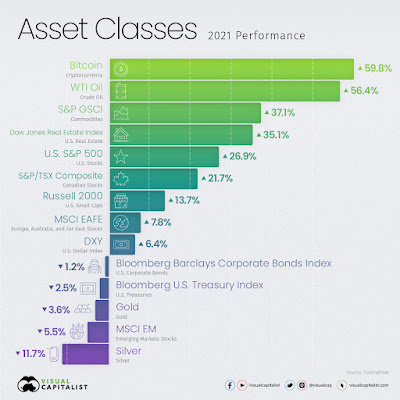
A couple of great charts from the Visual Capitalist showing how major asset classes performed in 2021 (click below to enlarge). It was another strong year for developed market stocks. The S&P 500 was up nearly 27% beating 2020's impressive 15.5% gain, with every sector positive. The MSCI EAFE (developed markets xUSA) was up close to 8% (versus +5% in 2020). But the year's best performing asset was Bitcoin, up nearly 60%, which is great...but far less than the nearly 380% the digital coin gained in 2020. Of course, now that Bitcoin has gone mainstream (as evinced by its nearly $1 trillion market cap and constant market tracking on CNBC alongside major stock indices), such triple-digit returns are unlikely, even as its volatility and correlation to public equities goes up.

Energy also had a great 2021, after struggling mightily in 2020. Oil was up over 56% after dropping more than 21% last year. Energy was also the best performing sector in the S&P 500, up nearly 48%, followed by Real Estate (+42.5%), Tech (+33.4%) and Financials (+32.5%). The "weakest" S&P 500 sector was Utilities, up only 14%.

What didn't work in 2021 was fixed income and EM stocks. Treasuries and bonds fell 2.5% and 1.2%, respectively, as inflation and interest rate volatility jumped. The benchmark Bloomberg Barclays US Aggregate Index declined by 1.5%, its first annual loss since 2013 and only for the fourth time in nearly 40 years. EM economies are beneficiaries of low US interest rates and so, naturally, rising rates also hurt EM stocks. Surprisingly, last year's best performers silver (+47.4%) and gold (+24.6%), struggled in 2021, despite a long history of being an inflation hedge. Perhaps because of Bitcoin?   


Tuesday, December 29, 2020

2020: Amid the Gloom a Record Year for iBanking

Every crisis is an opportunity for someone. The pandemic has been catastrophic for many small businesses, but many large businesses, particularly in Tech, have thrived. Who else did well? Their bankers

Things looked bleak when credit markets froze in Feb. But after central banks came to the rescue, corporations raced to raise cash and lock in cheap long-term funding. According to the FT, companies raised a record $5T of debt in 2020. It was a robust year for equity offerings as well, with more than $300B raised through IPOs and secondaries. And all that debt and equity underwriting generated record fees for global banks--$125B worth!


The five largest US banks account for ~30% or $37B of the year's total investment banking fees. That haul should mean a very merry bonus season, at least at GS and MS. The other three firms all have big commercial banking arms and will need to set aside extra reserves for potential loan losses that have put pressure on their stock prices: the KWB Bank Index is down 14% YTD. All that reserving could shrink some of the rainmakers' pay at JPM, BoA and Citi...but probably not by much (if one bank pays well, everyone else dutifully follows). So expect Manhattan real estate to pick up again in February!

Felicidades España, los Campeones del Mundo!!

An imperious defense and dazzling passing helped La Roja to win the World Cup Fewest Goal Conceded in World Cup: 1   Golden Ball (Best Playe...